
QSAR models should be able to extrapolate
Ligand-based QSAR (quantitative structure-activity relationship) models have long been a workhorse of drug discovery, where they are used to guide hit discovery and lead optimization efforts (Cherkasov, et al., 2014; Muratov, et al., 2020). However, it is widely understood that QSAR models are only accurate within their applicability domains: the regions of chemical space near previously characterized compounds with experimentally evaluated potencies. QSAR models can safely interpolate between these known compounds, but are not trusted to extrapolate to more distant regions of chemical space. This limits the utility of QSAR models for exploring the vast majority of synthesizable, drug-like chemical space that is distant from known ligands.
Such modesty is alien to modern machine learning (ML). Extrapolation is necessary to solve common ML tasks, such as image recognition. Correspondingly, since the deep learning revolution (e.g., Krizhevsky, et al., 2012), ML algorithms have successfully extrapolated far from the data on which they are trained.
In this post, we will characterize the disconnect between the small molecule drug discovery, where ML models are conventionally constrained to interpolation, and more traditional ML tasks, which rely on extrapolation. The broad generalization achieved by machine learning algorithms suggests that this should also be possible for small molecule activity prediction, facilitating better hit discovery and lead optimization. In a future post, we will show that powerful machine learning can produce superior QSAR predictions outside a conservative applicability domain, whereas it is difficult to surpass trivial interpolation within such an applicability domain.
Applicability domains ensure accurate predictions for QSAR models
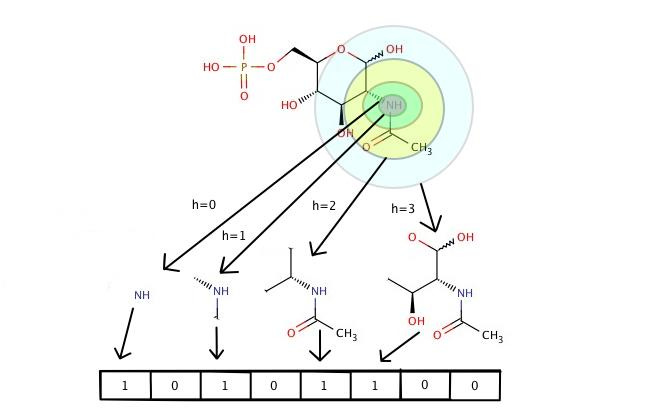
The applicability domains of QSAR models are commonly defined in terms of the Tanimoto distance on Morgan fingerprints to the molecules of the training set. The training set consists of molecules with experimentally evaluated potencies, used to set the parameters of the QSAR model. Morgan fingerprints (sometimes called extended connectivity fingerprints; ECFP) identify the set of radius-n fragments in a molecule. The Tanimoto distance between two molecules is (roughly) the percentage of fragments that are present in only one of the molecules, out of those present in at least one of the molecules. You can find a slightly more detailed description of Tanimoto distance on Morgan fingerprints at the end of this post.
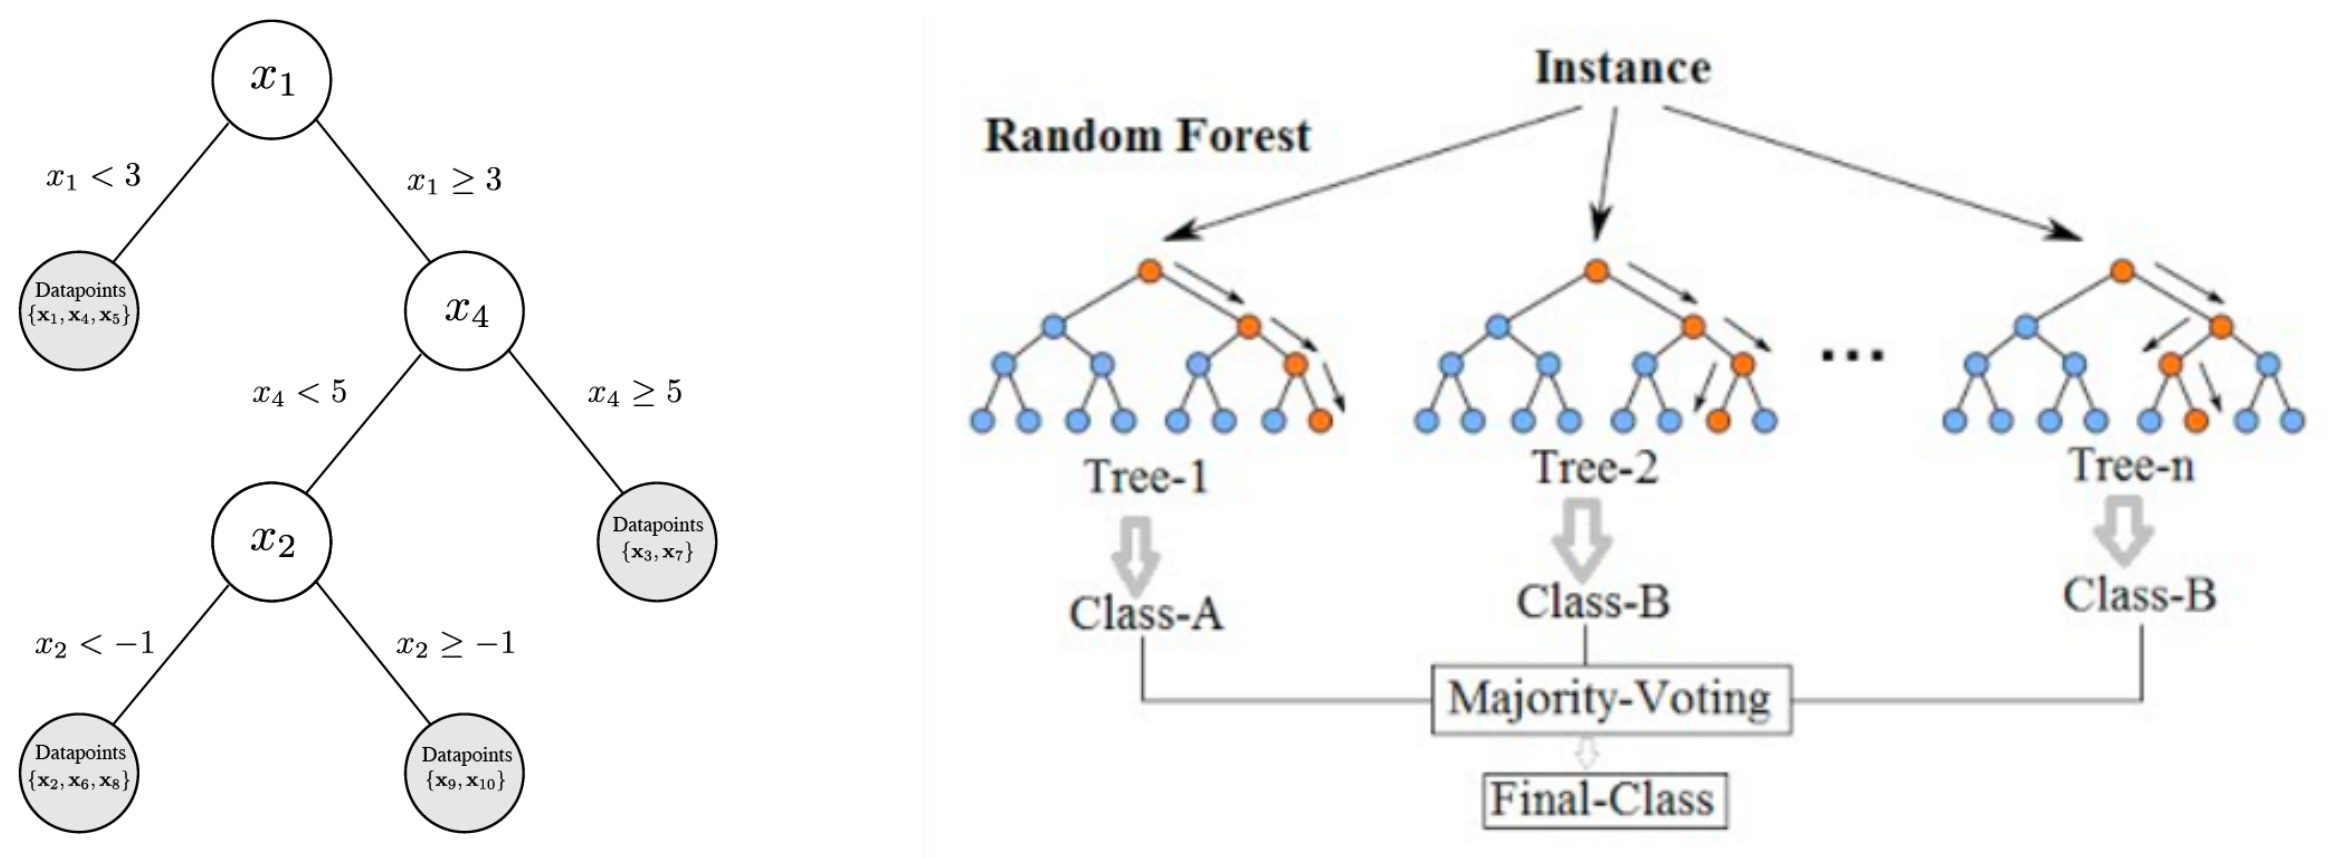
Most conventional QSAR algorithms produce their activity predictions based upon a molecular fingerprint; often the Morgan fingerprint. Common QSAR algorithms include k-nearest neighbors, which computes the (weighted) average of the k most similar molecules in the training set; random forests (and related algorithms like extra-trees, gradient boosted decision trees, and XGBoost), which take the average of many decision trees; and support vector machines, which (implicitly) nonlinearly project the input into a high-dimensional space before performing linear regression. These simple algorithms remain very competitive for small molecule potency prediction (Cichońska, et al., 2021; Huang, et al., 2021; Stanley, et al., 2021; van Tilborg, et al., 2022).
More recently, deep learning algorithms have been applied to small molecule potency prediction. Deep learning applies many successive layers of trainable non-linear transformations to a molecular representation, such as a molecular fingerprint. Deep learning algorithms can also operate directly on SMILES strings or molecular graphs. A more detailed description of the algorithms evaluated below can be found at the end of this post.
The prediction error of QSAR models increases as the Tanimoto distance to the nearest element of the training set increases. This is unsurprising in light of the molecular similarity principle (Maggiora, et al., 2014): a molecule similar to a known potent ligand is probably potent itself; a molecule similar to a known inactive is probably inactive. In contrast, it is difficult to predict the activity of a molecule that is distant from any experimentally characterized compound.
The increase in QSAR error with distance to the nearest element of the training set is strong and robust. In Figure 1, we evaluate the mean-squared error (MSE) when predicting log IC50 using a variety of different QSAR algorithms. In this and Figure 2, performance is evaluated on a dataset of log IC50 measurements curated from published papers and patents, subject to a scaffold split, and aggregated across 37 kinase targets. The overall trend is similar across algorithms with completely different structures when distance is characterized with Tanimoto distance on Morgan fingerprints.
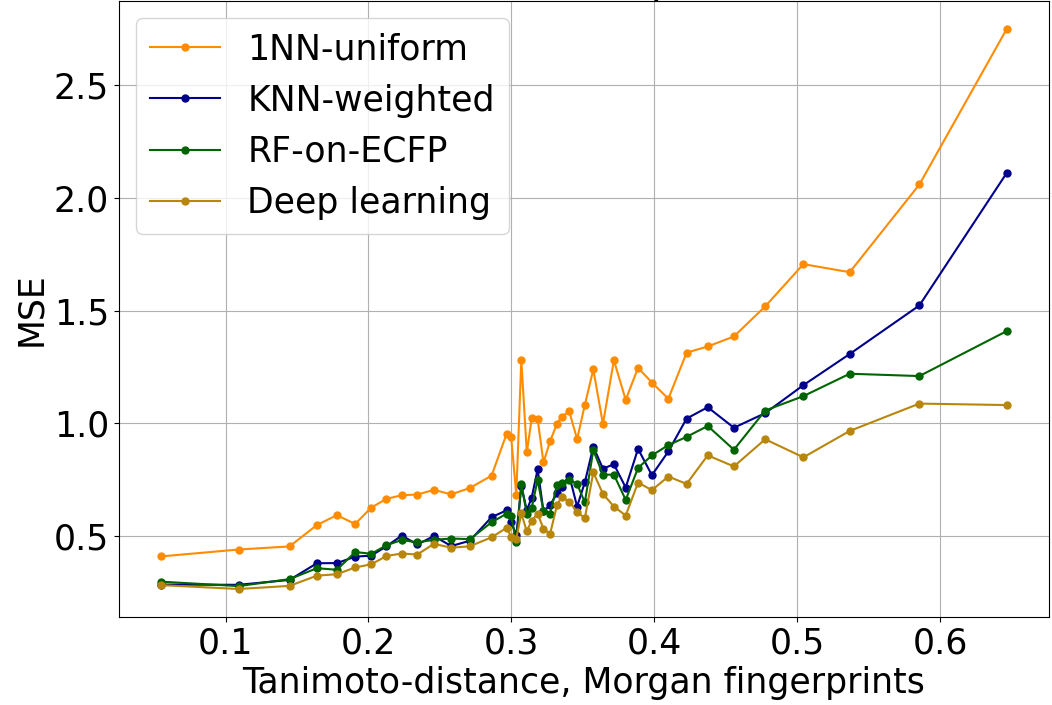
Figure 1: Mean-squared error of log IC50 predictions, versus Tanimoto distance on Morgan fingerprints to the nearest element of the training set. The trend is similar across a variety of QSAR algorithms of varying power and sophistication. 1NN-uniform and KNN-weighted are k nearest neighbors algorithms (k=6 in this plot). RF-on-ECFP is a random forest on Morgan fingerprints. Deep learning is Enki, our proprietary algorithm developed from the ground up for the prediction and optimization of pharmacological properties like potency and selectivity.
Figure 2 shows that this trend is preserved across diverse measures of distance to the training set. Rather than identifying rooted trees, path-based fingerprints consider linear chains (i.e., paths) within the molecular graph, and atom-pair fingerprints summarize such chains to just the end nodes and the number of bonds between them. Tanimoto distance can be computed on both atom-pair and path-based fingerprints. The negative log-likelihood under the prior evaluates how typical a molecule is of those in the training set using the log-probability assigned by our proprietary generative AI algorithm, Enki. Gaussian process variance is the uncertainty at the test molecule of a simple Gaussian-like prior distribution when conditioned on the training data, using Tanimoto distance on Morgan fingerprints to define the covariance of the prior. To facilitate comparison across incommensurable distance metrics, we plot the quantile of the distance to the training set. We show results for random forests in Figure 2; other algorithms are similar.
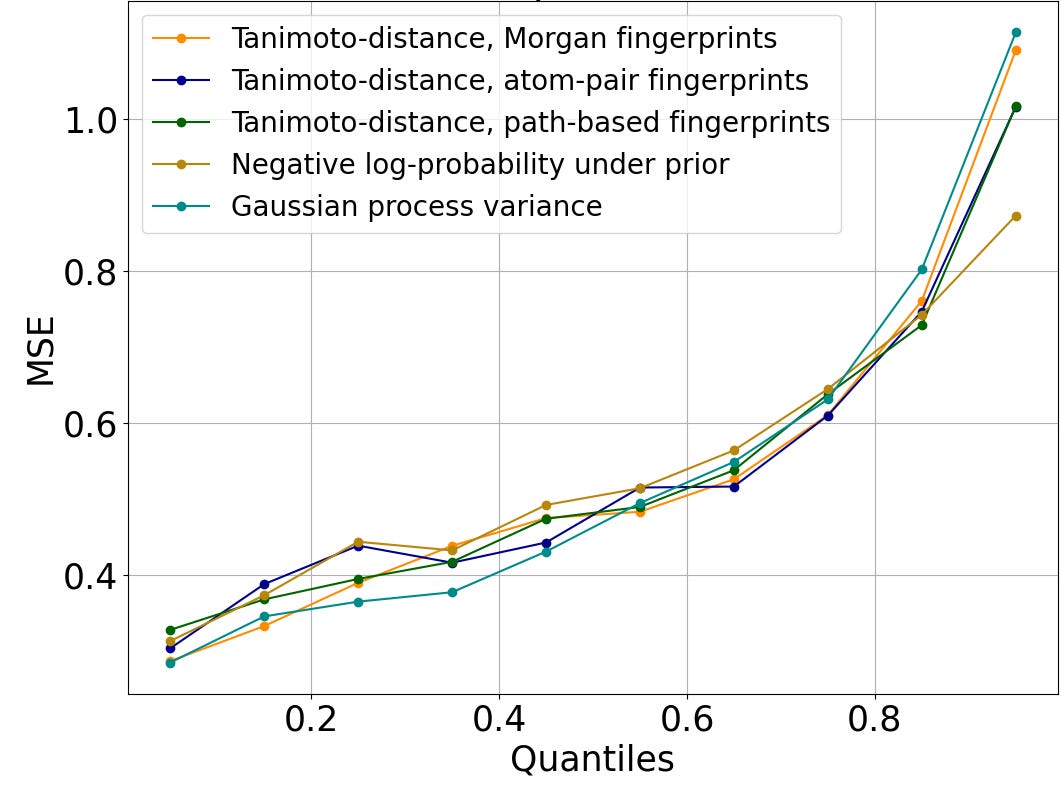
Figure 2: Mean-squared error of log IC50 predictions, versus the percentage of the test set molecules with smaller distance to the closest element of the train set than the query molecule. The trend is similar regardless of the metric used to evaluate distance.
Regardless of the QSAR algorithm or distance metric used, error is small when the query molecule is close to the training set. A mean squared error of 0.25 on the log IC50 corresponds to a typical error of a little more than 3x error on the IC50; accurate enough to support hit discovery and lead optimization. Indeed, this is comparable to the error of repeated measurements in ChEMBL (Kalliokoski, et al., 2013), although it is significantly greater than the error of repeated measurements in our experimental dataset.
QSAR prediction errors grow larger as the distance to the nearest element of the training set increases. A mean-squared error of 1.0 on log IC50 corresponds to a typical error of about 10x in IC50; a mean-squared error of 2.0 on log IC50 corresponds to a typical error of ~1.4 on log IC50, or a ~26x error in IC50. This is still sufficient to distinguish between a potent lead and an inactive compound.
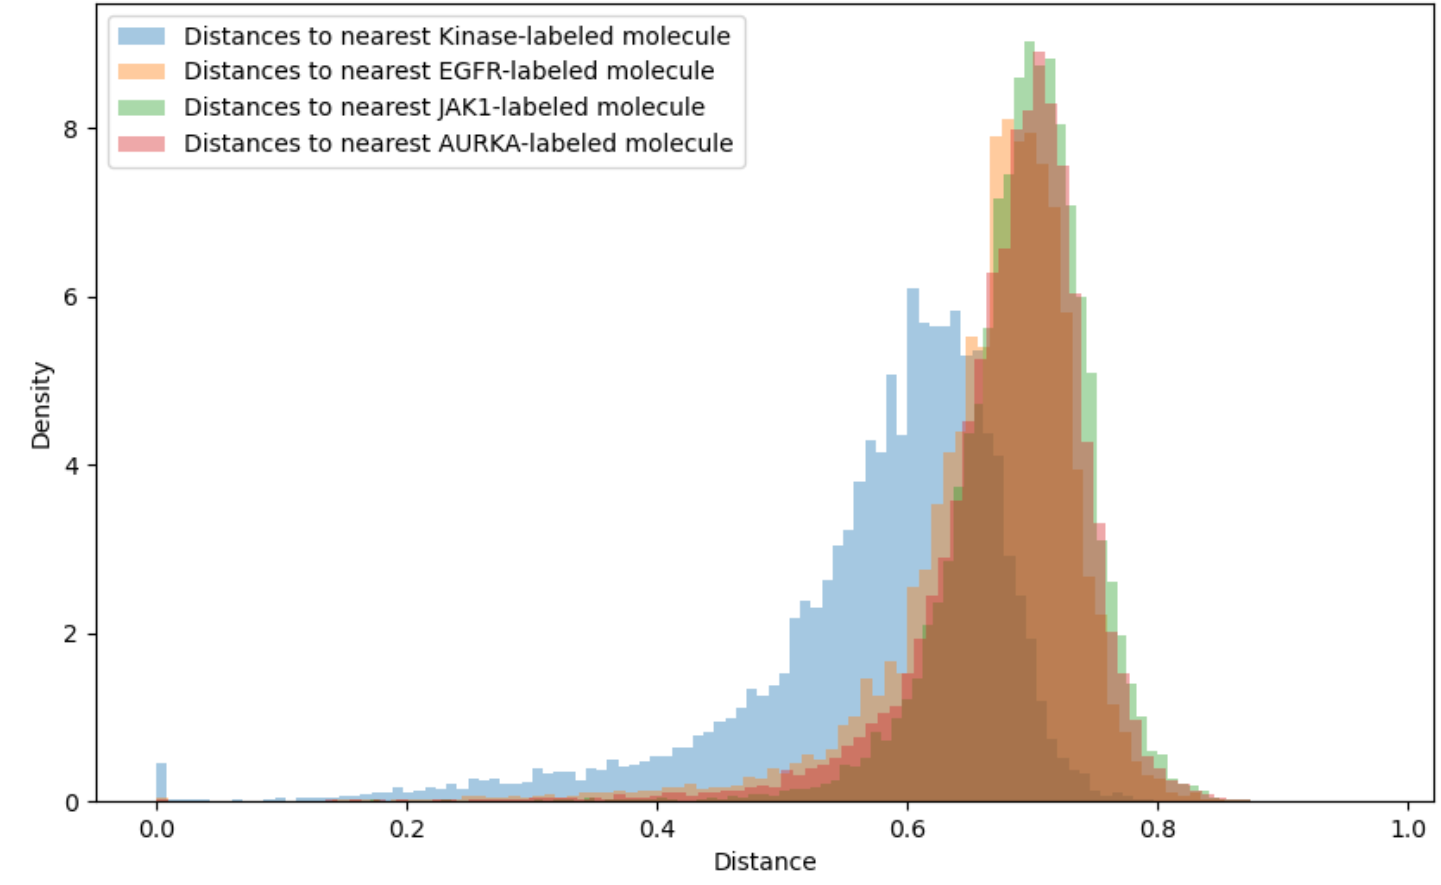
Applicability domains restrict attention to those molecules for which the QSAR model is sufficiently accurate. For instance, a threshold of 0.4 or 0.6 might be imposed on the Tanimoto distance to the closest element of the training set. Unfortunately, as shown in Figure 3, the vast majority of synthesizable, drug-like compounds have Tanimoto distance on Morgan fingerprints greater than 0.6 to the nearest previously tested compound for common kinase targets. Extrapolation beyond conventional applicability domains is necessary to access all but a tiny fraction of chemical space.
Extrapolation is necessary and possible for conventional ML tasks, like image recognition
Prediction error does not increase with distance from the training set in traditional machine learning tasks like image recognition, when using modern machine learning techniques. Many of these algorithms were developed using the ImageNet dataset (Deng, et al., 2009). The standard version of ImageNet contains 1,000 different classes, each of which has approximately 1,000 instances in the training set. One might naively imagine that images of a single class, such as Persian cats, would be similar to each other, and different from those of other classes, such as electric fans. However, consider Figure 4, which contains pairs of images, within and between these two classes, with minimum Euclidean distance in pixel space.
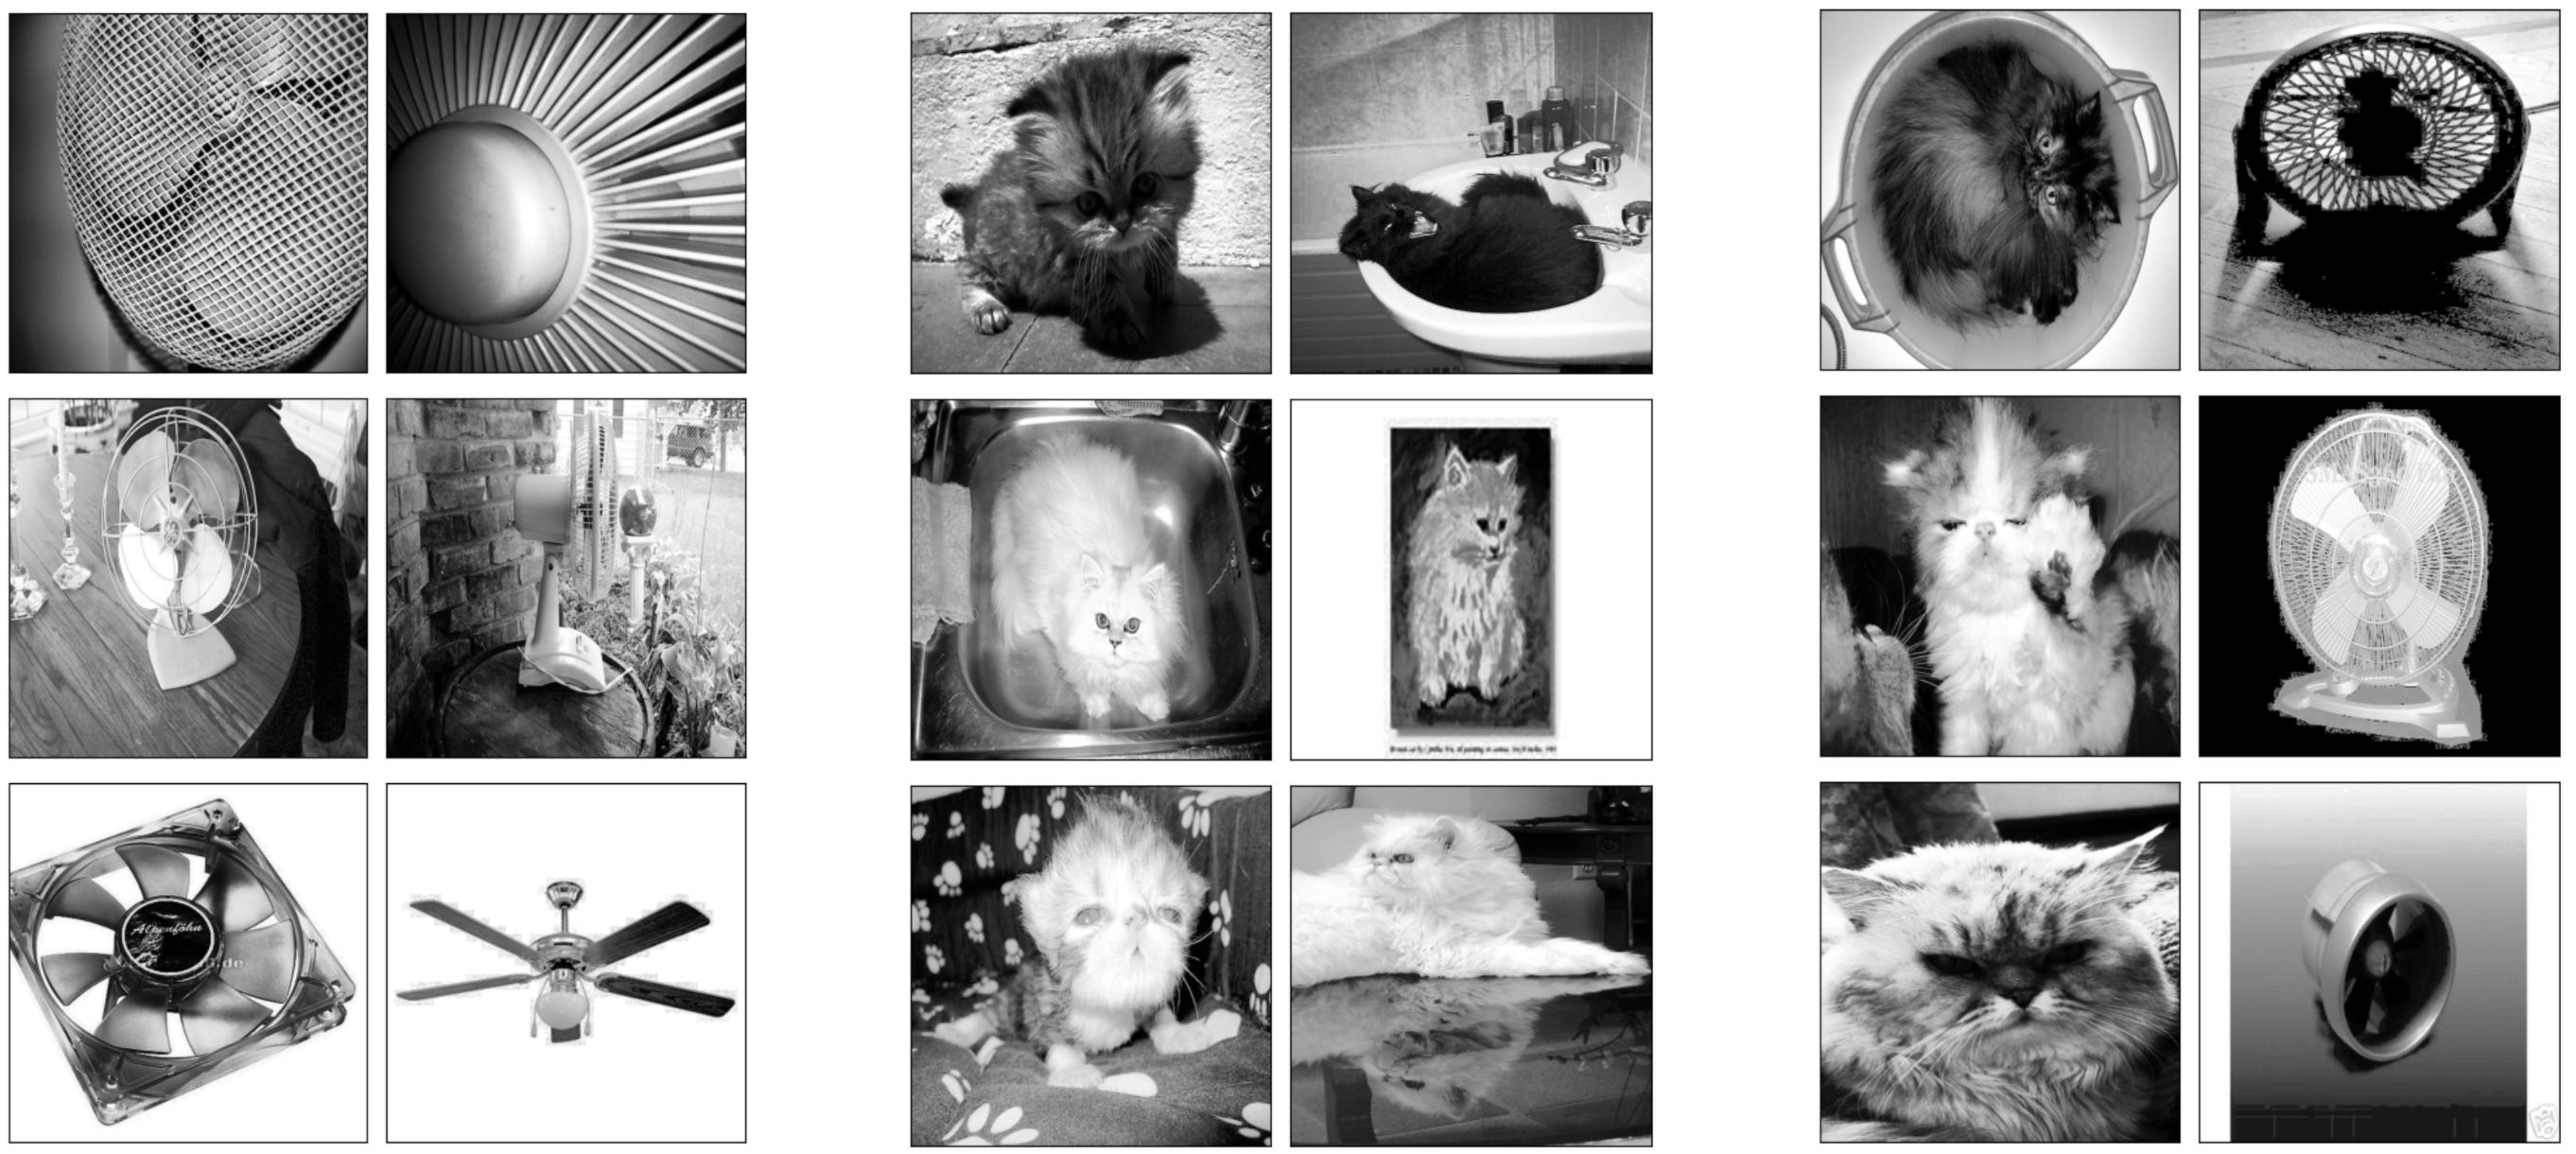
Figure 4: Pairs of ImageNet images with minimum Euclidean distance in pixel space. The first group contains pairs of electric fans; the second contains pairs of Persian cats; and the third matches Persian cats with electric fans.
The unifying feature of each pair is the overall pattern of light and dark, rather than any semantic property. Correspondingly, Figure 5 shows that the distribution of distances between image pairs from the same class is indistinguishable from that of image pairs from different classes. This holds whether we consider all pairs (on the left of Figure 5) or only the closest match to each query image (on the right of Figure 5).
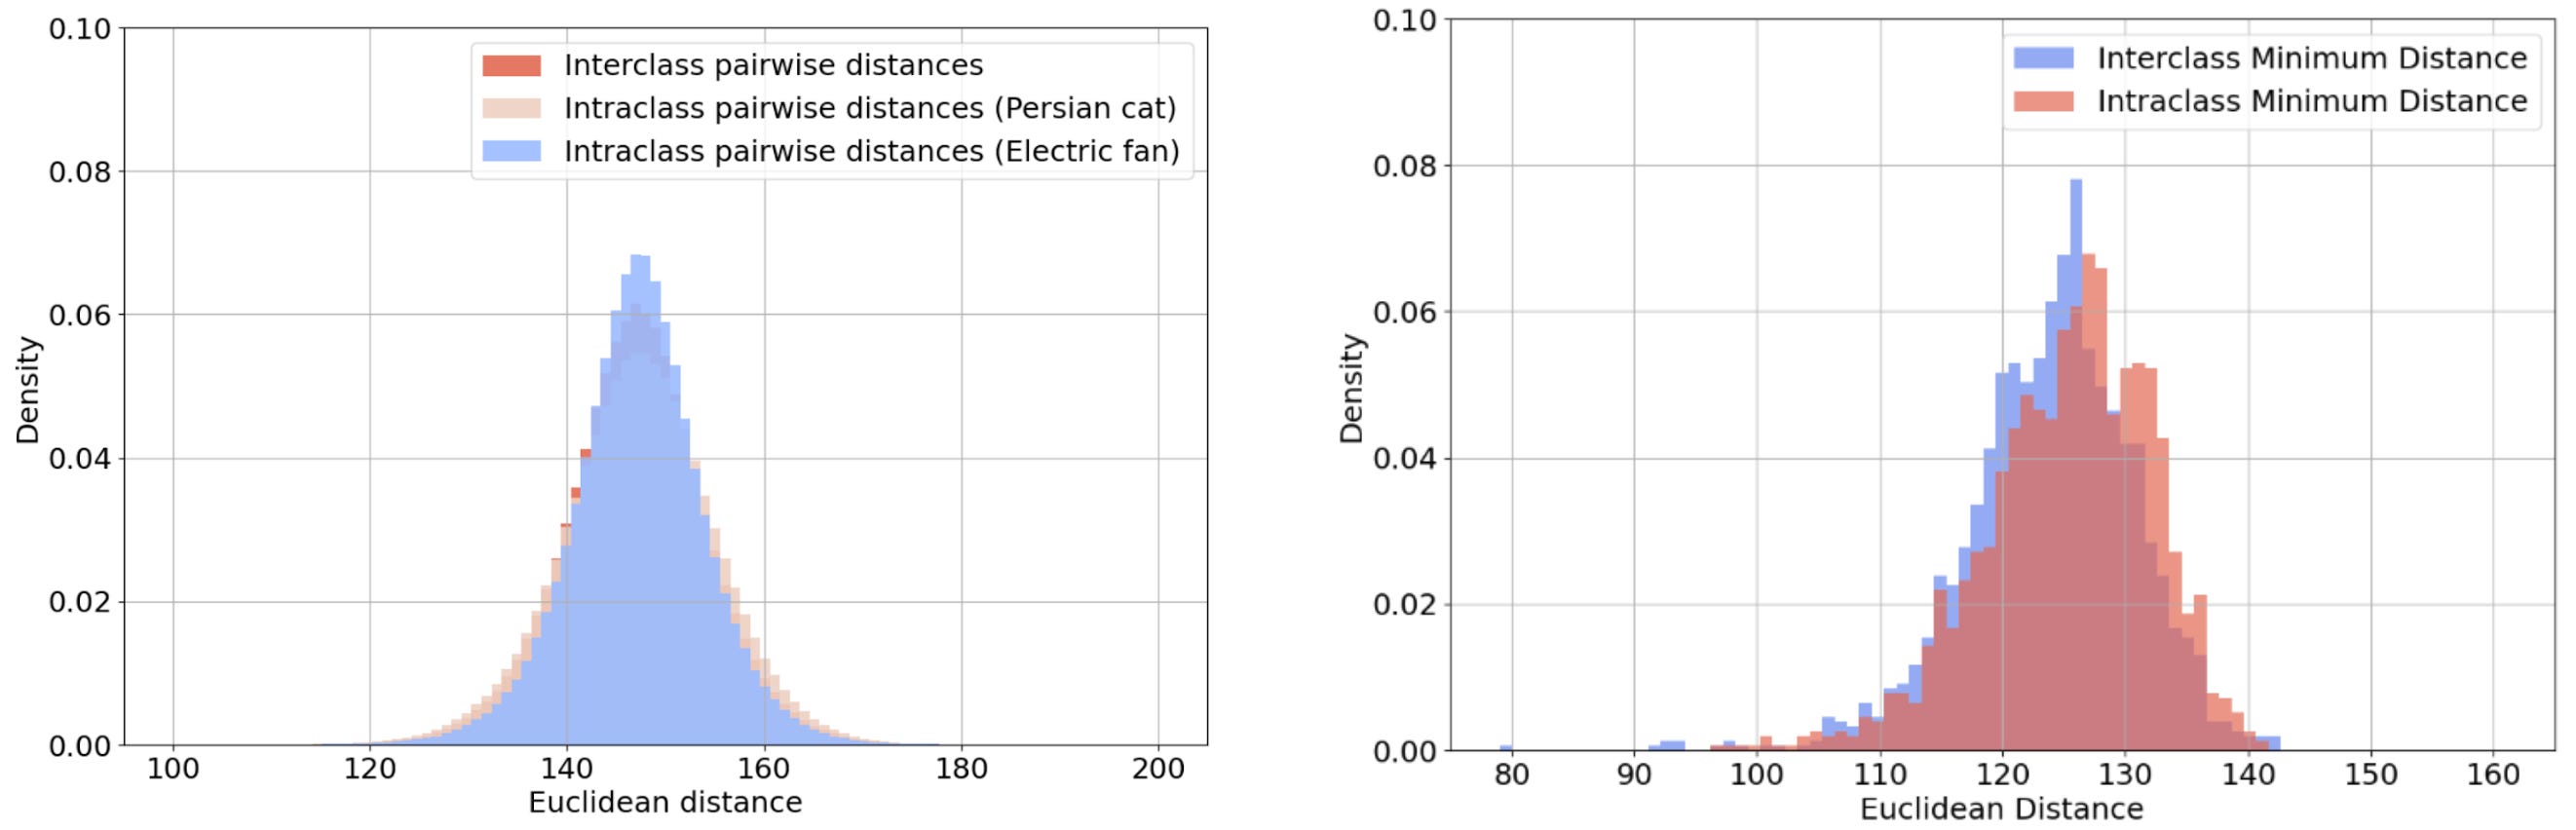
Figure 5: The distribution of distances between image pairs from the same or different classes. The left histogram plots the distances of all such pairs, whereas the right histogram plots only the distance to the closest match to each query image.
Despite the lack of pixel-level similarity between images in the same class, standard deep learning algorithms like ResNeXt demonstrate an exceptional ability to predict the correct class out of the 1,000 possibilities in ImageNet: 80.9% accuracy for ResNeXt (Xie, et al., 2017), and as high as 92.4% with more recent algorithms (Srivastava & Sharma, 2024), surpassing human performance (Shankar, et al., 2020).
Figure 6 shows that the performance of these algorithms is uncorrelated with the distance to the nearest image in the training set. Deep learning algorithms for image classification do not have an applicability domain in pixel space. They could not achieve high accuracy if they did have a limited applicability domain, since images of unrelated classes are just as close as images of the same class.
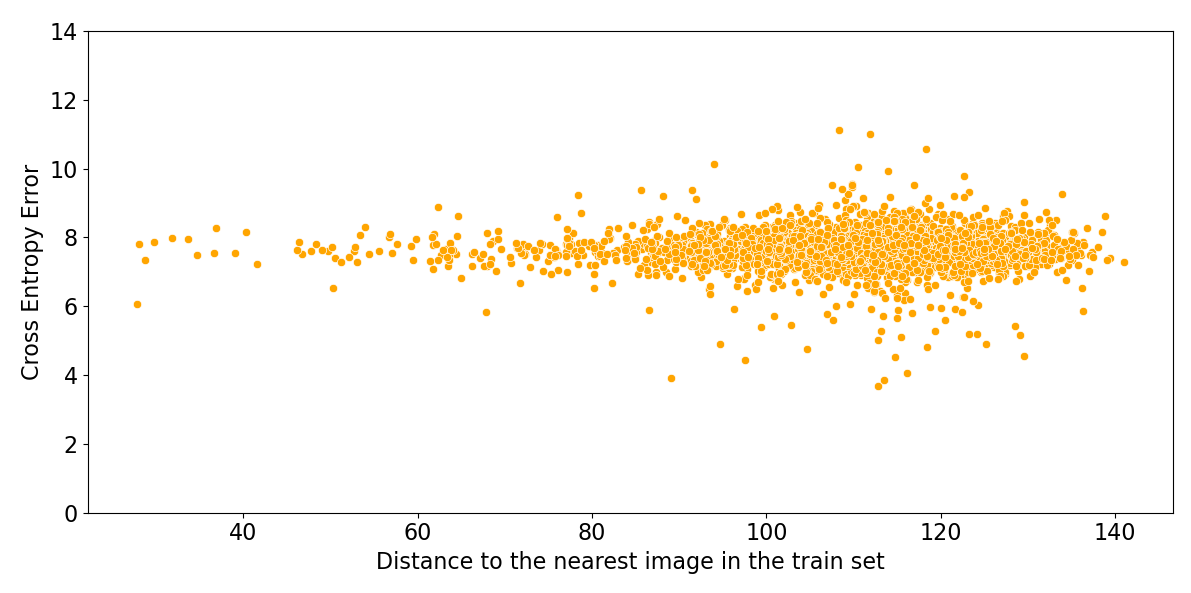
Figure 6: Log probability assigned to the correct class by ResNeXt, versus Euclidean distance in pixel space to the nearest image in the training set.
Extrapolation is also evident in the few-shot capabilities of deep learning algorithms. For instance, after pretraining on a large labeled dataset, image classifiers can learn to predict a new ImageNet class with 84.6% accuracy on the basis of 10 examples, and 63.6% accuracy with only 1 example (Singh, et al., 2023). Similarly, large language models can answer questions for which they have not been explicitly trained, given either a few examples (Brown, et al., 2020), or even using only their base training corpus (Kojima, et al., 2022).
Reconciling extrapolation in conventional ML with limited applicability domains in QSAR
Based upon the broad generalization achieved by deep learning algorithms on conventional ML tasks, we might expect to realize comparably accurate extrapolation when predicting the potency of small molecules against protein targets. We will show evidence in the next post that extrapolation improves and applicability domains widen as the power of the machine learning algorithms and the amount of training data are increased. This suggests that there is no fundamental difference between small molecule potency prediction and conventional ML tasks. Rather, we only need to develop algorithms that are better matched to the QSAR task, and increase the effective size of our datasets.
Details on Tanimoto distance on Morgan fingerprints
To make the Tanimoto distance computation tractable, rather than evaluating each fragment separately, the fragments are divided into groups (1024 and 2048 are common numbers of groups). This division into groups is done in a manner that is unrelated to the chemical properties of the fragments. The Tanimoto distance is calculated over these groups, rather than the original fragments. The Morgan fingerprint (virtually identical to the extended connectivity fingerprint – ECFP) identifies which groups have an instance in the molecule.
Description of QSAR algorithms
1-nearest neighbor (1NN-uniform) predicts the log IC50s of the molecule in the training set with the smallest Tanimoto distance (using Morgan fingerprints) to the query molecule.
Weighted k-NN (KNN-weighted) predicts the average of the log IC50s of the k=6 molecules in the training set with the smallest Tanimoto distance to the query molecule, with the average weighted by the inverse distance.
Random forest on Morgan fingerprints (RF-on-ECFP) uses the average of many decision trees, each of which is trained on a subset of the training set. Random forests and related algorithms like XGBoost are still amongst the most commonly used algorithms in cheminformatics, and continue to achieve competitive performance in the domain of data science; e.g., in Kaggle competitions. However, they have been superseded by neural networks (e.g., ResNets, Transformers) in traditional ML tasks like image classification and natural language processing.
We also report the performance of Enki, our proprietary deep learning algorithm developed from the ground up for the prediction and optimization of pharmacological properties like potency, selectivity, ADME, and toxicity.
References
Brown, T., Mann, B., Ryder, N., Subbiah, M., Kaplan, J. D., Dhariwal, P., … & Amodei, D. (2020). Language models are few-shot learners. Advances in neural information processing systems, 33, 1877-1901.
Cherkasov, A., Muratov, E. N., Fourches, D., Varnek, A., Baskin, I. I., Cronin, M., … & Tropsha, A. (2014). QSAR modeling: where have you been? Where are you going to?. Journal of medicinal chemistry, 57(12), 4977-5010.
Cichońska, A., Ravikumar, B., Allaway, R. J., Wan, F., Park, S., Isayev, O., … & Challenge organizers. (2021). Crowdsourced mapping of unexplored target space of kinase inhibitors. Nature communications, 12(1), 3307.
Deng, J., Dong, W., Socher, R., Li, L. J., Li, K., & Fei-Fei, L. (2009, June). Imagenet: A large-scale hierarchical image database. In 2009 IEEE conference on computer vision and pattern recognition (pp. 248-255). Ieee.
Deselaers, T., & Ferrari, V. (2011, June). Visual and semantic similarity in imagenet. In CVPR 2011 (pp. 1777-1784). IEEE.
Huang, K., Fu, T., Gao, W., Zhao, Y., Roohani, Y., Leskovec, J., … & Zitnik, M. (2021). Therapeutics data commons: Machine learning datasets and tasks for drug discovery and development. arXiv preprint arXiv:2102.09548.
Kalliokoski, T., Kramer, C., Vulpetti, A., & Gedeck, P. (2013). Comparability of mixed IC50 data–a statistical analysis. PloS one, 8(4), e61007.
Kojima, T., Gu, S. S., Reid, M., Matsuo, Y., & Iwasawa, Y. (2022). Large language models are zero-shot reasoners. Advances in neural information processing systems, 35, 22199-22213.
Krizhevsky, A., Sutskever, I., & Hinton, G. E. (2012). Imagenet classification with deep convolutional neural networks. Advances in neural information processing systems, 25.
Maggiora, G., Vogt, M., Stumpfe, D., & Bajorath, J. (2014). Molecular similarity in medicinal chemistry: miniperspective. Journal of medicinal chemistry, 57(8), 3186-3204.
Muratov, E. N., Bajorath, J., Sheridan, R. P., Tetko, I. V., Filimonov, D., Poroikov, V., … & Tropsha, A. (2020). QSAR without borders. Chemical Society Reviews, 49(11), 3525-3564.
Shankar, V., Roelofs, R., Mania, H., Fang, A., Recht, B., & Schmidt, L. (2020, November). Evaluating machine accuracy on imagenet. In International Conference on Machine Learning (pp. 8634-8644). PMLR.
Singh, M., Duval, Q., Alwala, K. V., Fan, H., Aggarwal, V., Adcock, A., … & Misra, I. (2023). The effectiveness of MAE pre-pretraining for billion-scale pretraining. arXiv preprint arXiv:2303.13496.
Srivastava, S., & Sharma, G. (2024). OmniVec: Learning robust representations with cross modal sharing. In Proceedings of the IEEE/CVF Winter Conference on Applications of Computer Vision (pp. 1236-1248).
Stanley, M., Bronskill, J. F., Maziarz, K., Misztela, H., Lanini, J., Segler, M., … & Brockschmidt, M. (2021, August). Fs-mol: A few-shot learning dataset of molecules. In Thirty-fifth Conference on Neural Information Processing Systems Datasets and Benchmarks Track (Round 2).
van Tilborg, D., Alenicheva, A., & Grisoni, F. (2022). Exposing the limitations of molecular machine learning with activity cliffs. Journal of Chemical Information and Modeling, 62(23), 5938-5951.
Xie, S., Girshick, R., Dollár, P., Tu, Z., & He, K. (2017). Aggregated residual transformations for deep neural networks. In Proceedings of the IEEE conference on computer vision and pattern recognition (pp. 1492-1500).